Methods for analyzing non-coding genomic intervals and their applications in cancer biology
Nathan Sheffield, PhDOutline
COCOA
|
20%
35%
35%
10%
|
|
|
Background, LOLA/MIRA
RegionSet2vec
Other projects
◁ Questions ▷
Biological motivation

Cells alter phenotype by using DNA differently.

Breakdowns lead to disease


 Region pooling


Locus Overlap Analysis


Methylation-based Inference of Regulatory Activity (MIRA)


Coordinate Covariation Analysis (COCOA)
Goal: understand variation among individuals

Supervised differential analysis

Supervised continuous analysis

Unsupervised analysis
Epigenomic data: high-dimensional
and low-interpretable

Dimensionality reduction

Even with known groups
How can we annotate the source of variation?
COCOA Overview
 John Lawson
Coordinate Covariation Analysis
- Quantify variation into a 'target variable'
- Supervised (e.g. clincial variable).
- Unsupervised (e.g. PCA)
- Annotate target variable with region sets.
What is epigenetic signal covariation?
What is epigenetic signal covariation?

What is epigenetic signal covariation?

What is epigenetic signal covariation?

What is epigenetic signal covariation?

Covariation informs source of observed variation
1. Choose target variable
What is the variation we'd like to explain?
Supervised target

Unsupervised target

2. Quantify correlation with target variable

2. Quantify correlation with target variable

Permutation tests establish significance


Case studies
Breast cancer DNA methylation (Unsupervised)Breast cancer ATAC-seq (Unsupervised)
Kidney cancer DNA methylation (Supervised)
Pan-cancer EZH2 analysis
Breast cancer DNA methylation PCA

COCOA results for PC1

ER-related regions have higher loadings on PC1
Raw DNA Methylation in ER binding regions

COCOA results for PC1-4

COCOA results for PC1-4

COCOA meta-region plots for PC1-4

Case studies
Breast cancer DNA methylation (Unsupervised)Breast cancer ATAC-seq (Unsupervised)
Kidney cancer DNA methylation (Supervised)
Pan-cancer EZH2 analysis
Breast cancer ATAC-seq PCA

COCOA results for ATAC-seq

ER-related regions have higher loadings on PC1
COCOA results for ATAC-seq

Case studies
Breast cancer DNA methylation (Unsupervised)Breast cancer ATAC-seq (Unsupervised)
Kidney cancer DNA methylation (Supervised)
Pan-cancer EZH2 analysis
Kidney cancer DNA methylation (Supervised)

Rank region sets for methylation
that correlates with cancer stage
COCOA results for cancer stage

COCOA results for cancer stage

COCOA results for cancer stage

Case studies
Breast cancer DNA methylation (Unsupervised)Breast cancer ATAC-seq (Unsupervised)
Kidney cancer DNA methylation (Supervised)
Pan-cancer EZH2 analysis
DNA methylation in EZH2 regions and survival

DNA methylation in EZH2-binding regions most often positively correlated with risk of death.
Region-set 2 Vec
Embeddings of genomic region setsin lower dimensions.

Erfaneh Gharavi
Word embeddings
http://suriyadeepan.github.io
Word2vec model
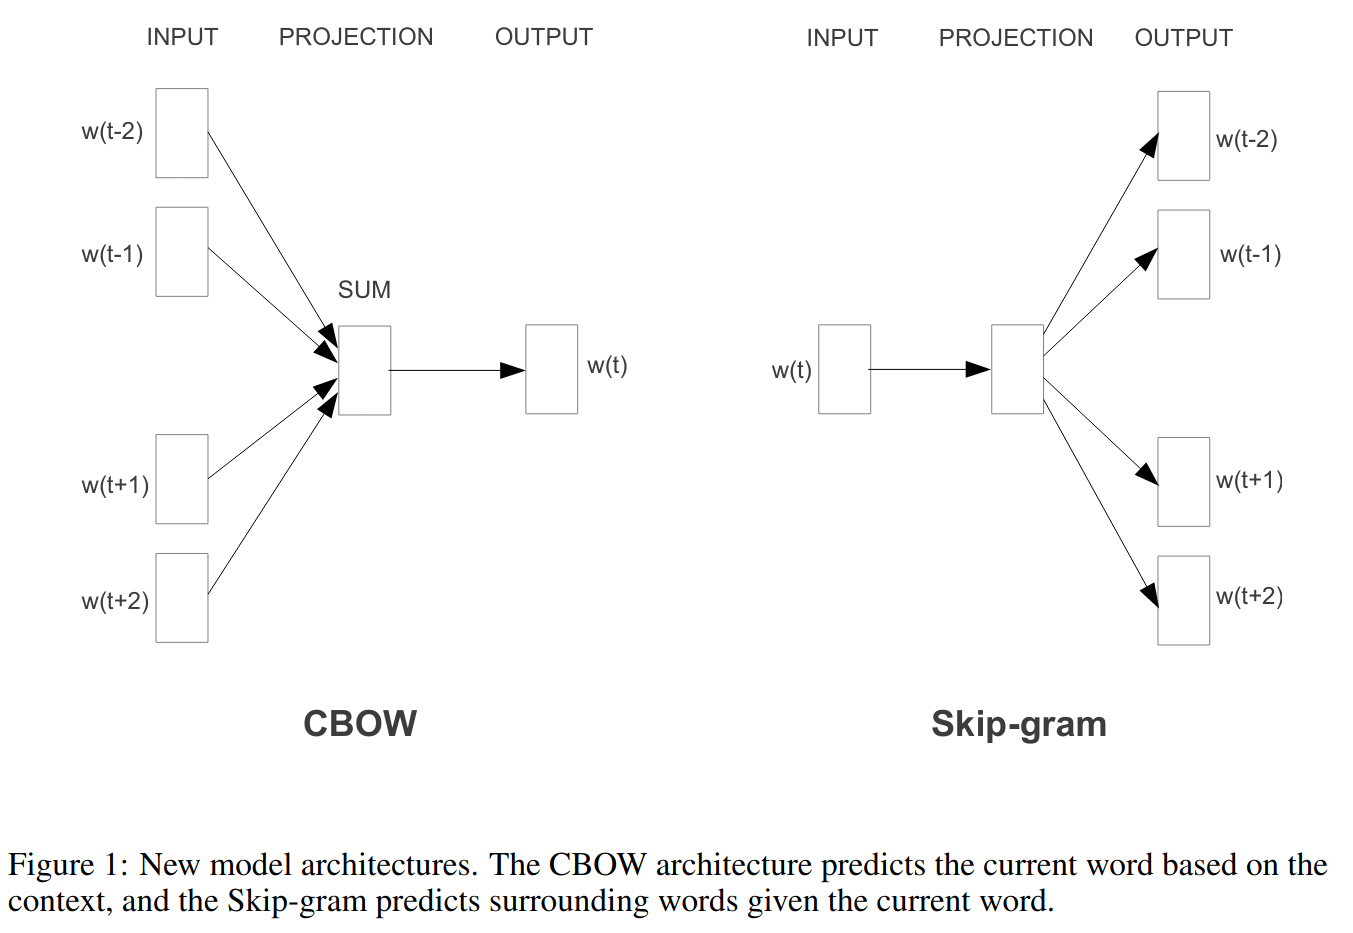
Word context
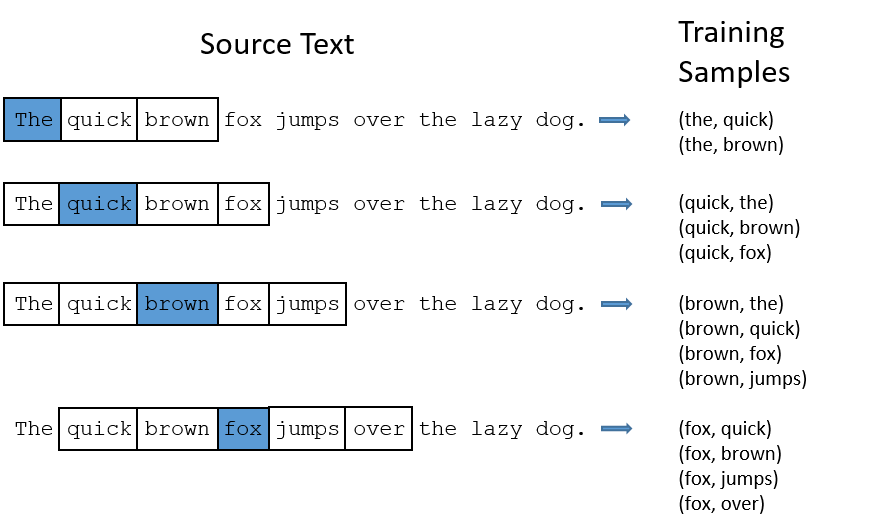
You shall know a word by the company it keeps. (Firth 1957)
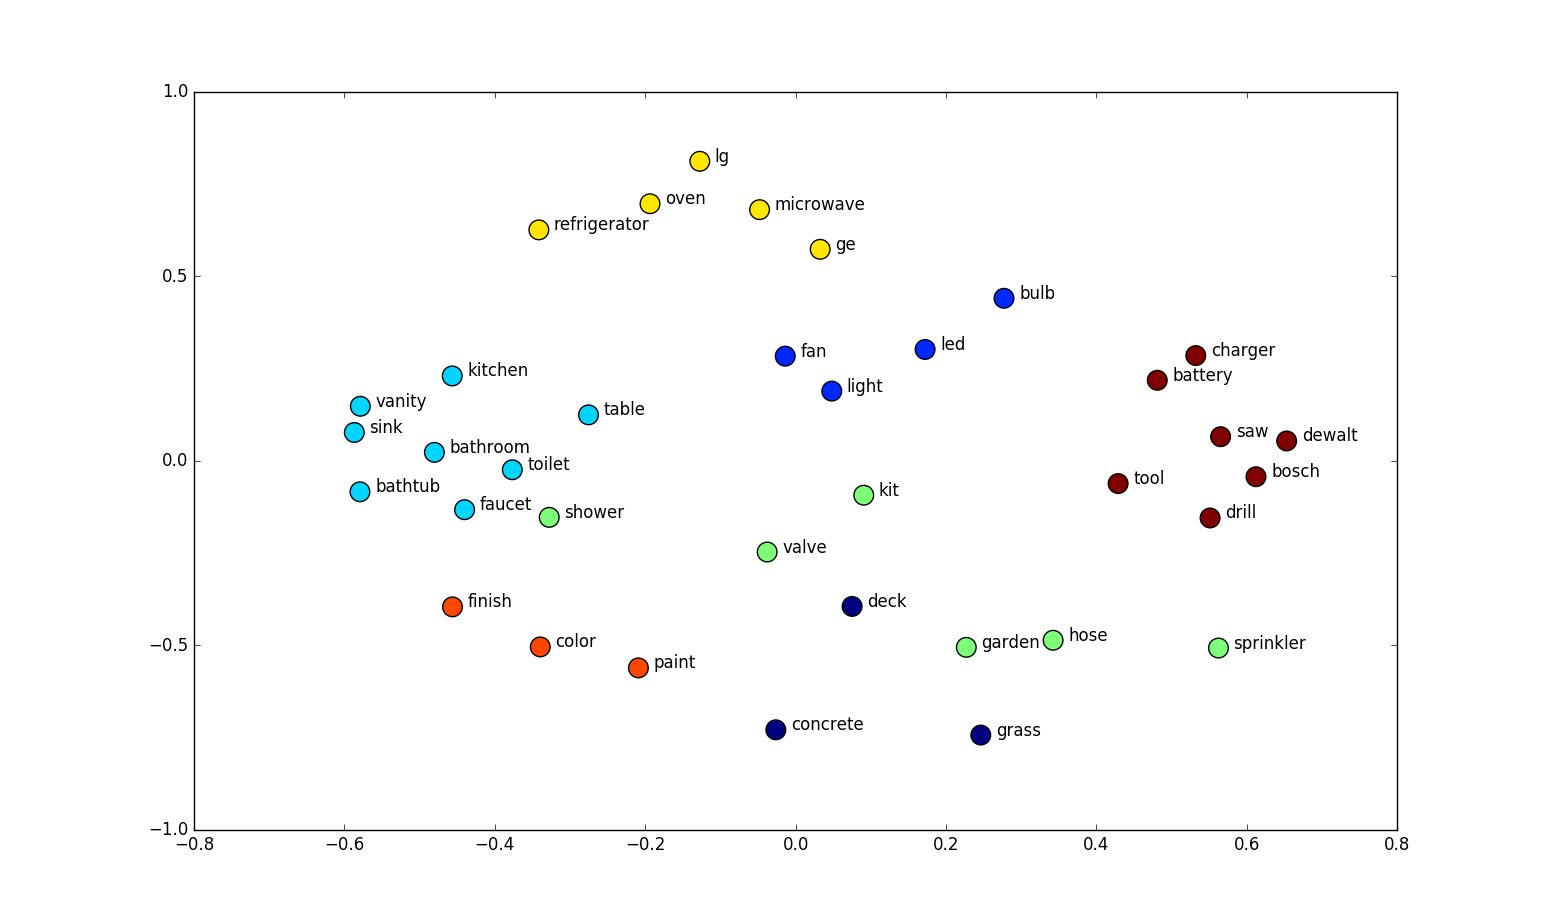
Words that occur in similar contexts tend to have similar meanings.
Words that occur in similar contexts tend to have similar meanings.
Image credit: Shubham Agarwal
Genomic context
A genomic interval is more likely to appear in a BED file with other genomic intervals of a similar function.

Genomic Interval Embeddings

Evaluation
We have created unsupervised 100-dimensional vector representations (embeddings) of region sets.Do relationships among vectors reflect biology?

Evaluation 1: Classification performance

Evaluation 1: Classification performance

Evaluation 1: Classification performance


Conclusion
- Regionset2vec adapts word2vec to learn genomic region embeddings
- Regionset2vec embeddings capture biological information
- NLP approaches can be adapted for applications in genomic interval analysis
Future applications
Cancer mutations

Single-cell


Thank You
Collaborators
Aakrosh Ratan
Aidong Zhang
Guangtao Zheng
Don Brown
Hyun Jae Cho
Mikhail Dozmorov
Fran Garrett-Backelman
Christoph Bock
Eleni Tomazou
Aakrosh Ratan
Aidong Zhang
Guangtao Zheng
Don Brown
Hyun Jae Cho
Mikhail Dozmorov
Fran Garrett-Backelman
Christoph Bock
Eleni Tomazou
Sheffield lab
Erfaneh Gharavi
Kristyna Kupkova
John Stubbs
Bingjie Xue
Jose Verdezoto
Nathan LeRoy
Oleksandr Khoroshevskyi
Alumni
Aaron Gu
Jianglin Feng
Tessa Danehy
Michal Stolarczyk
John Lawson
Jason Smith
Erfaneh Gharavi
Kristyna Kupkova
John Stubbs
Bingjie Xue
Jose Verdezoto
Nathan LeRoy
Oleksandr Khoroshevskyi
Alumni
Aaron Gu
Jianglin Feng
Tessa Danehy
Michal Stolarczyk
John Lawson
Jason Smith
Funding:


NIGMS R35-GM128636
NIGMS R35-GM128636